Our most essential report, the Net Promoter Score® Report, can be accessed in the left menu navigation under  . You'll find your Net Promoter Score charted here over time, including a trend line.
You will find all the usual filter options for date type and date range for the current project. You can also set a date increment, charting the NPS by for example week or month depending on your preference. Below the main chart, you will find the most recent promoter feedback and your team leaderboard.
[images for dashboard here]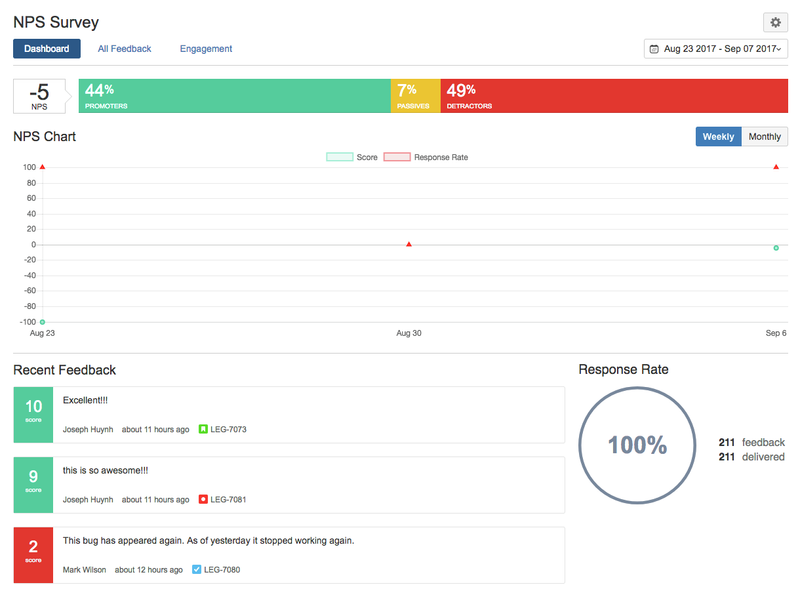
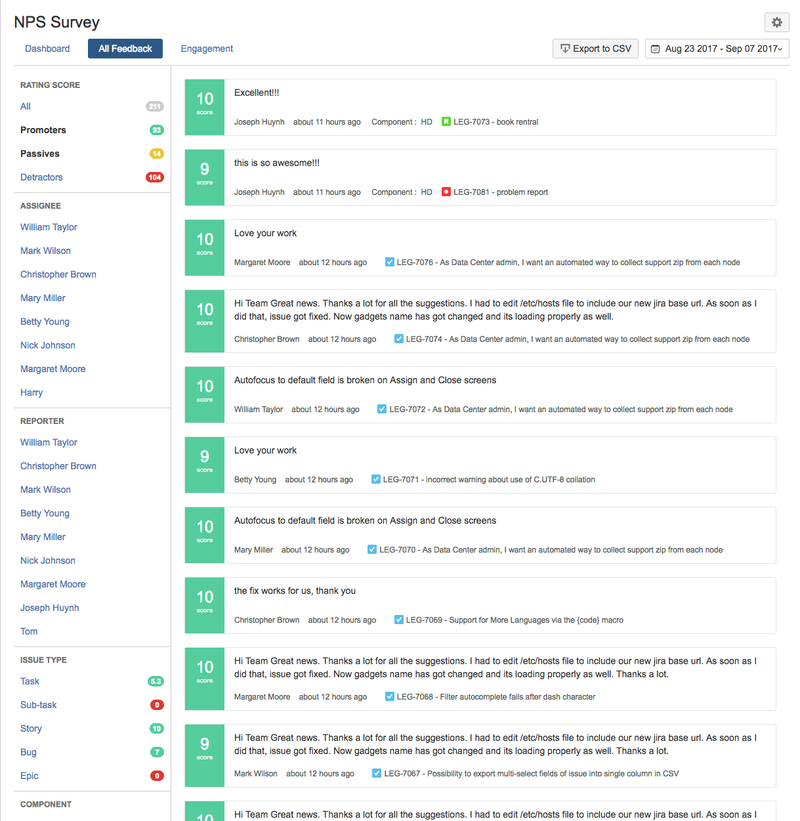
Aside from the Dashboard, you will find a page for All Feedback breaking down the responses by Response Type, Assignee, Reporter, Issue Type and Component. On this page you have the ability to export all the responses into csv (excel formatted file).
image for All Feedback Page]
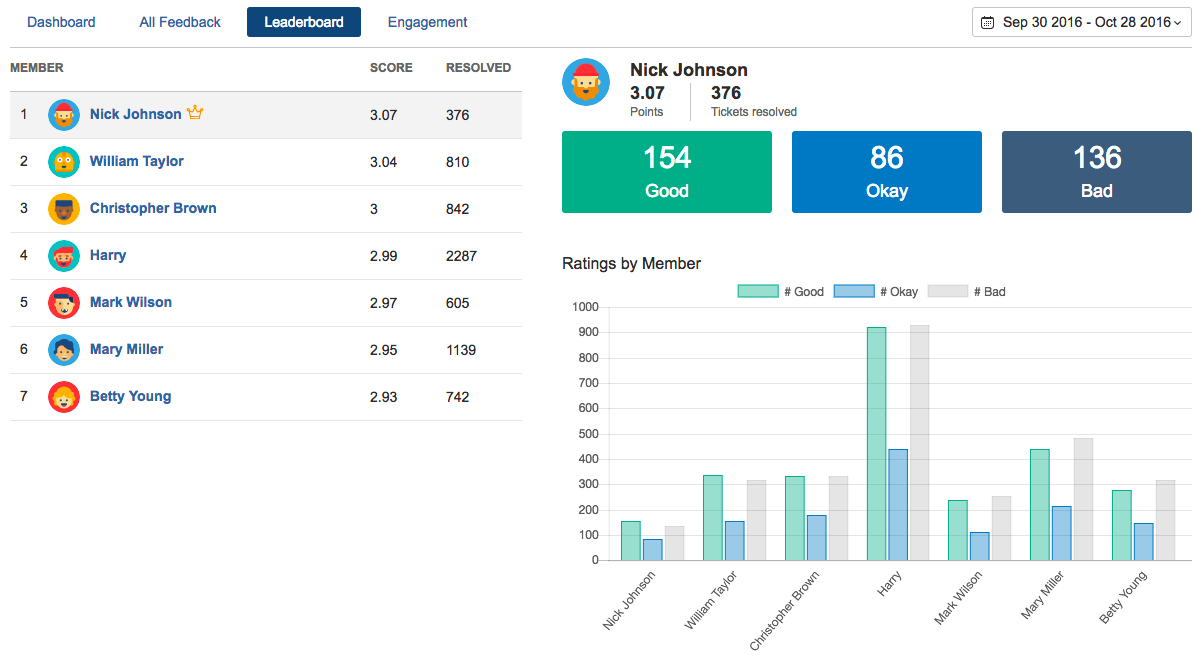
Moving on to the Leaderboard tab, you will find your top 10 agents ordered by their NPS score and number of resolved tickets.
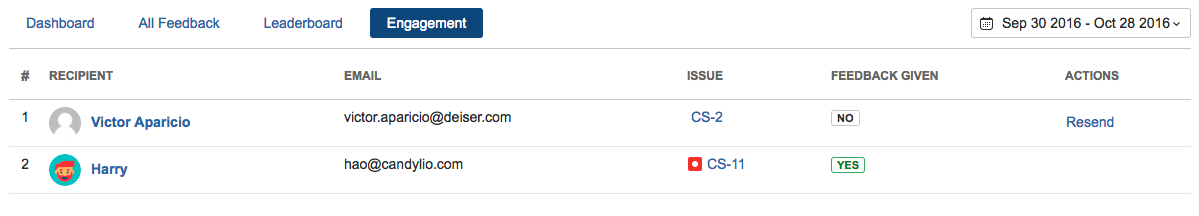
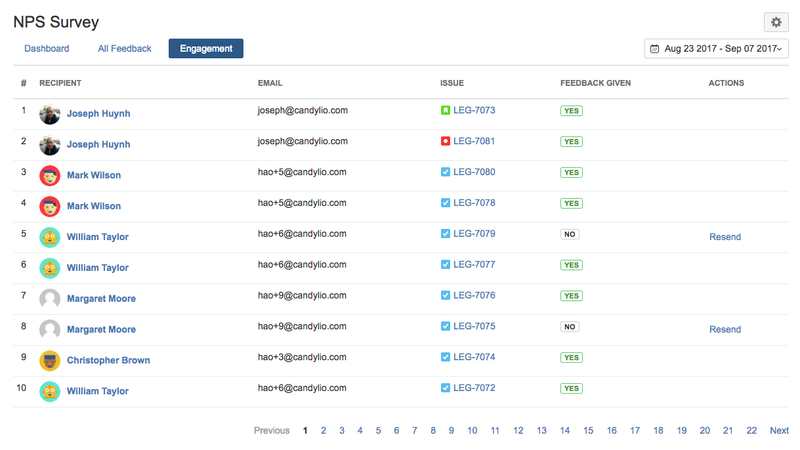
Engagement tab, allow you to monitor the survey status if feedback has been given for all the reporters with the option to resending a survey to any reporter.