...
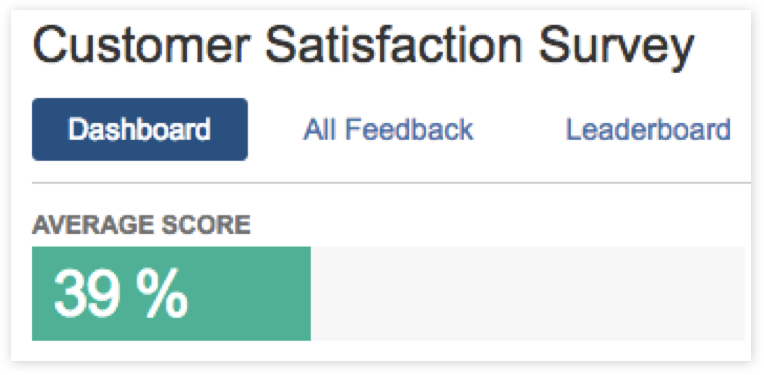
This is your overall Customer Satisfaction Score. From the image below we see that you have an average of 39% for your project. By itself, this number doesn’t tell you much.
 ]
]
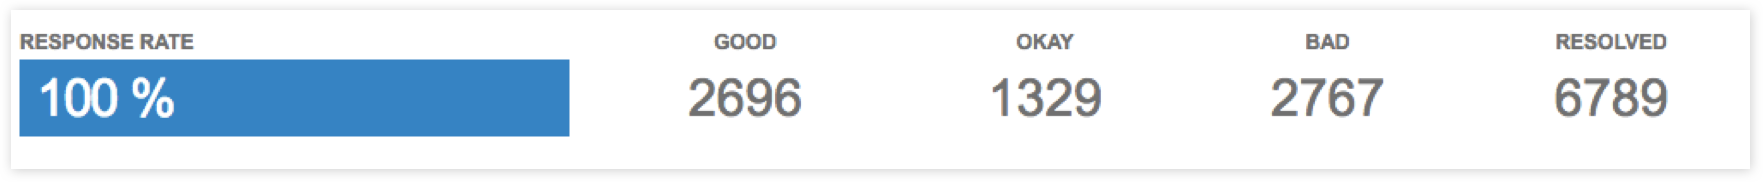
On the right you will see that your team received 100% response rate from 6789 reviews on the past 14 days, which tells you that the statistic is reliable.
But the key to analyzing this data is to dig one level deeper.

Below this you will see how satisfied are your customer over time. Try and find if there are any patterns here. In some cases you might find that your customers are particularly upset when you kept them waiting for too long on Monday.

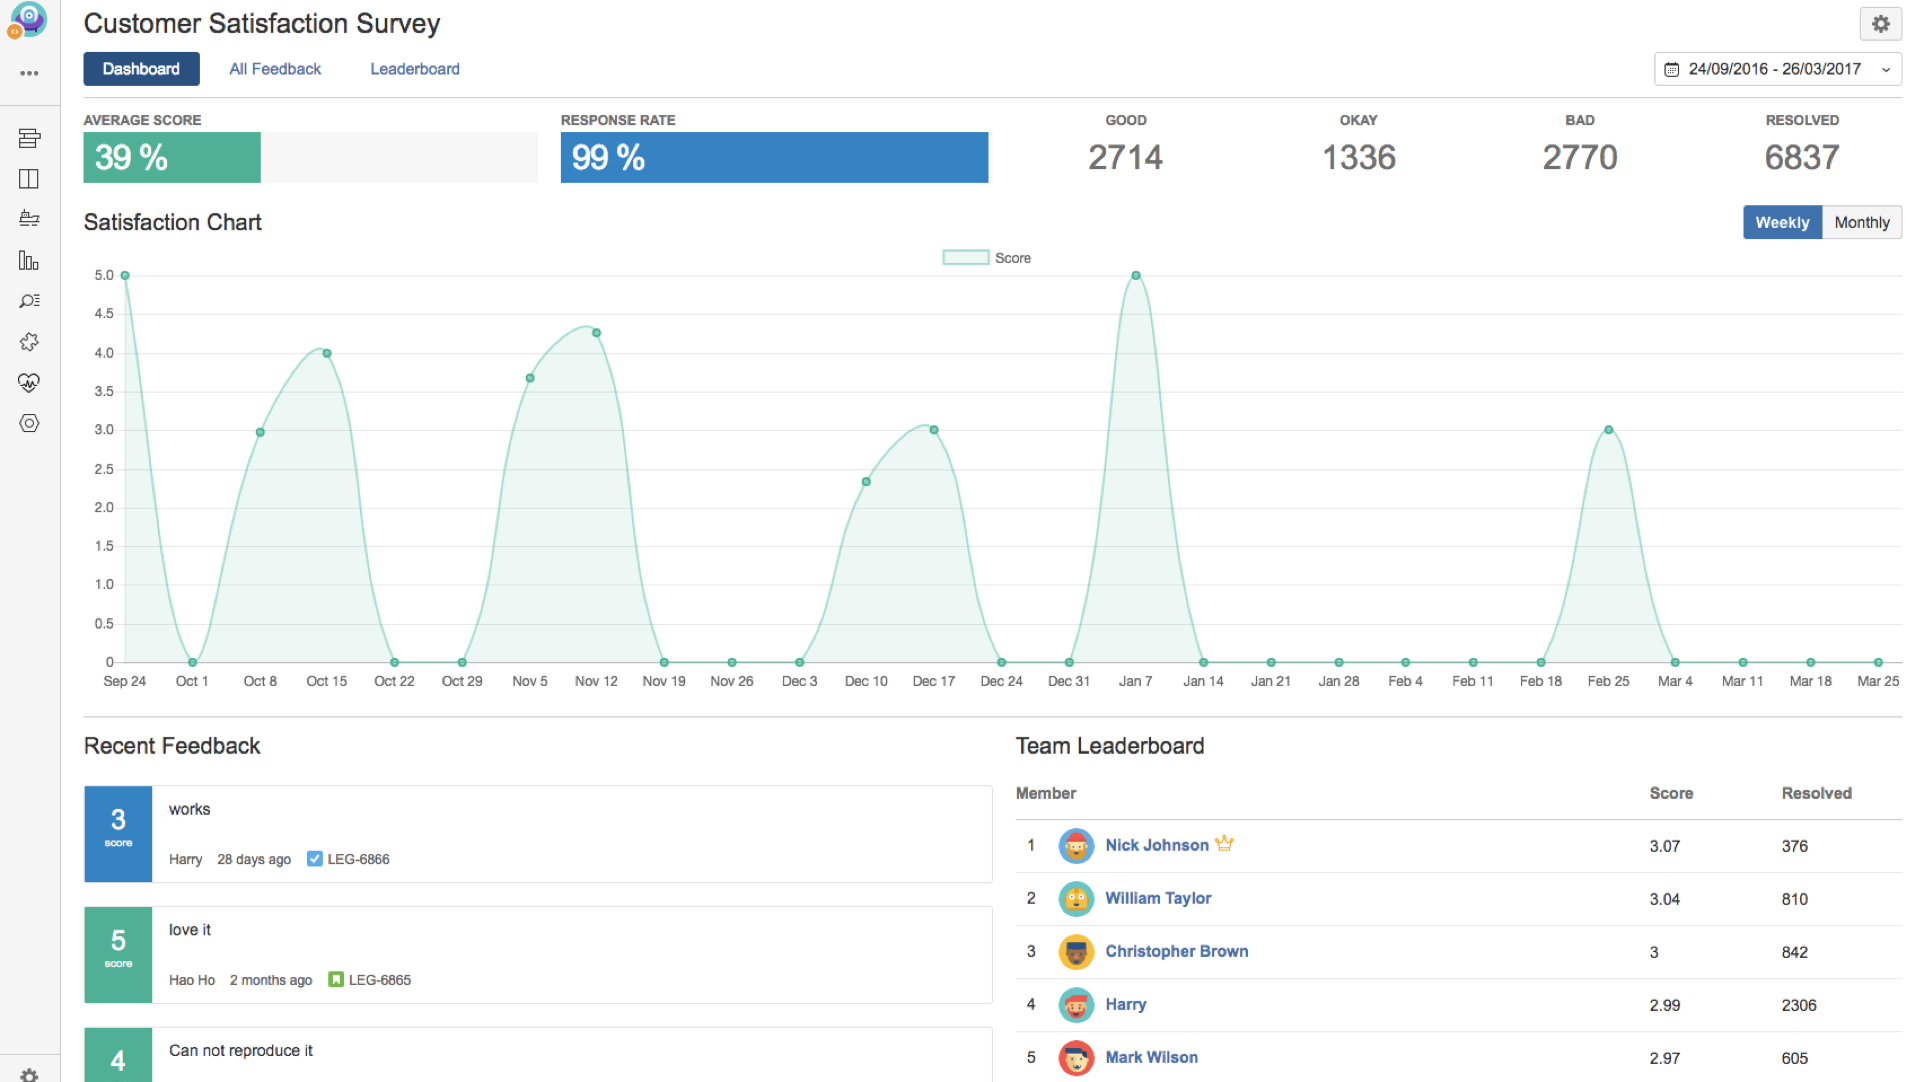
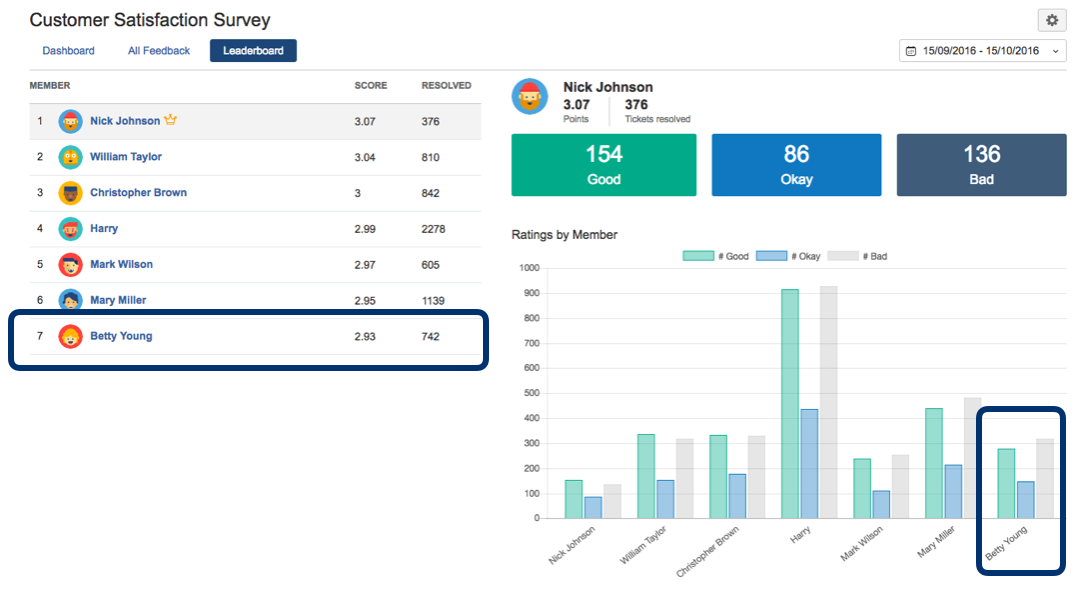
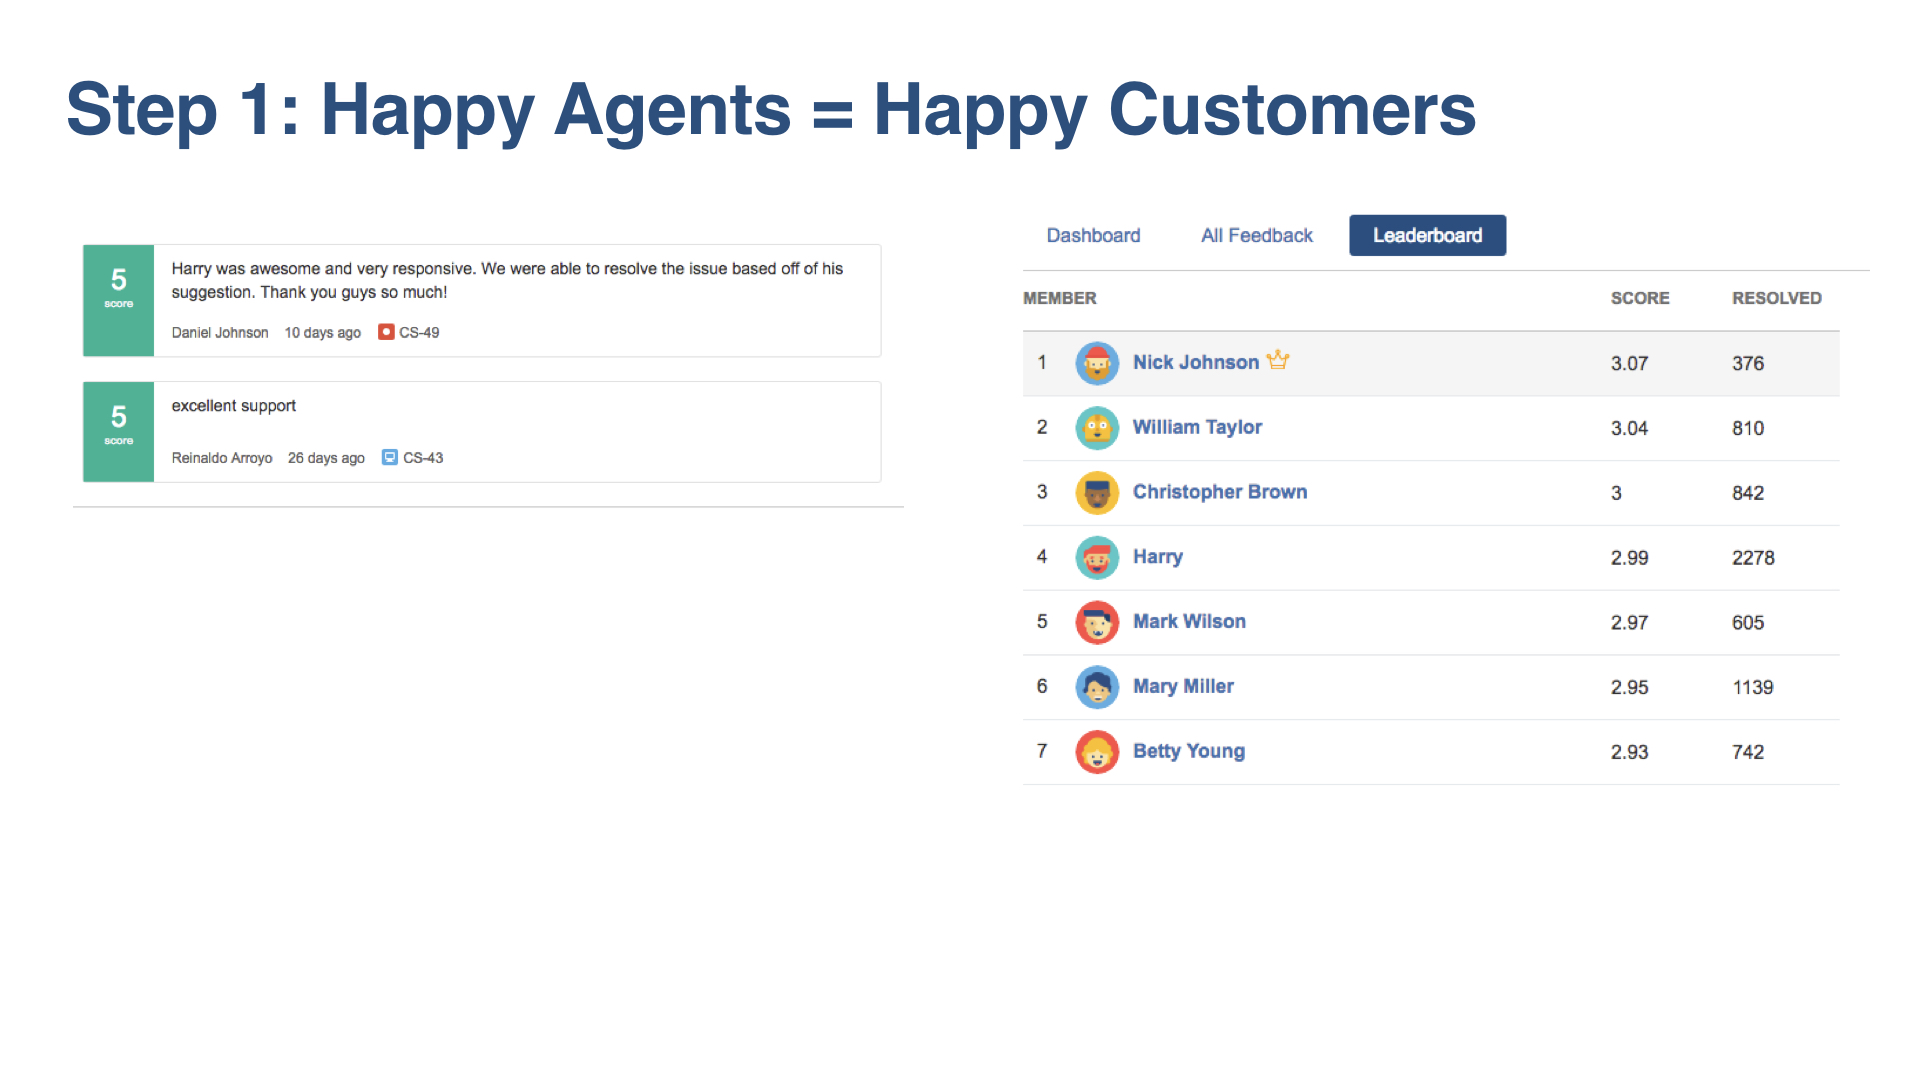
Team Leaderboard
...
Now, you see that Betty Young may need some extra help.

All Feedback
You could also look at the distribution of survey scores by the type of service request:

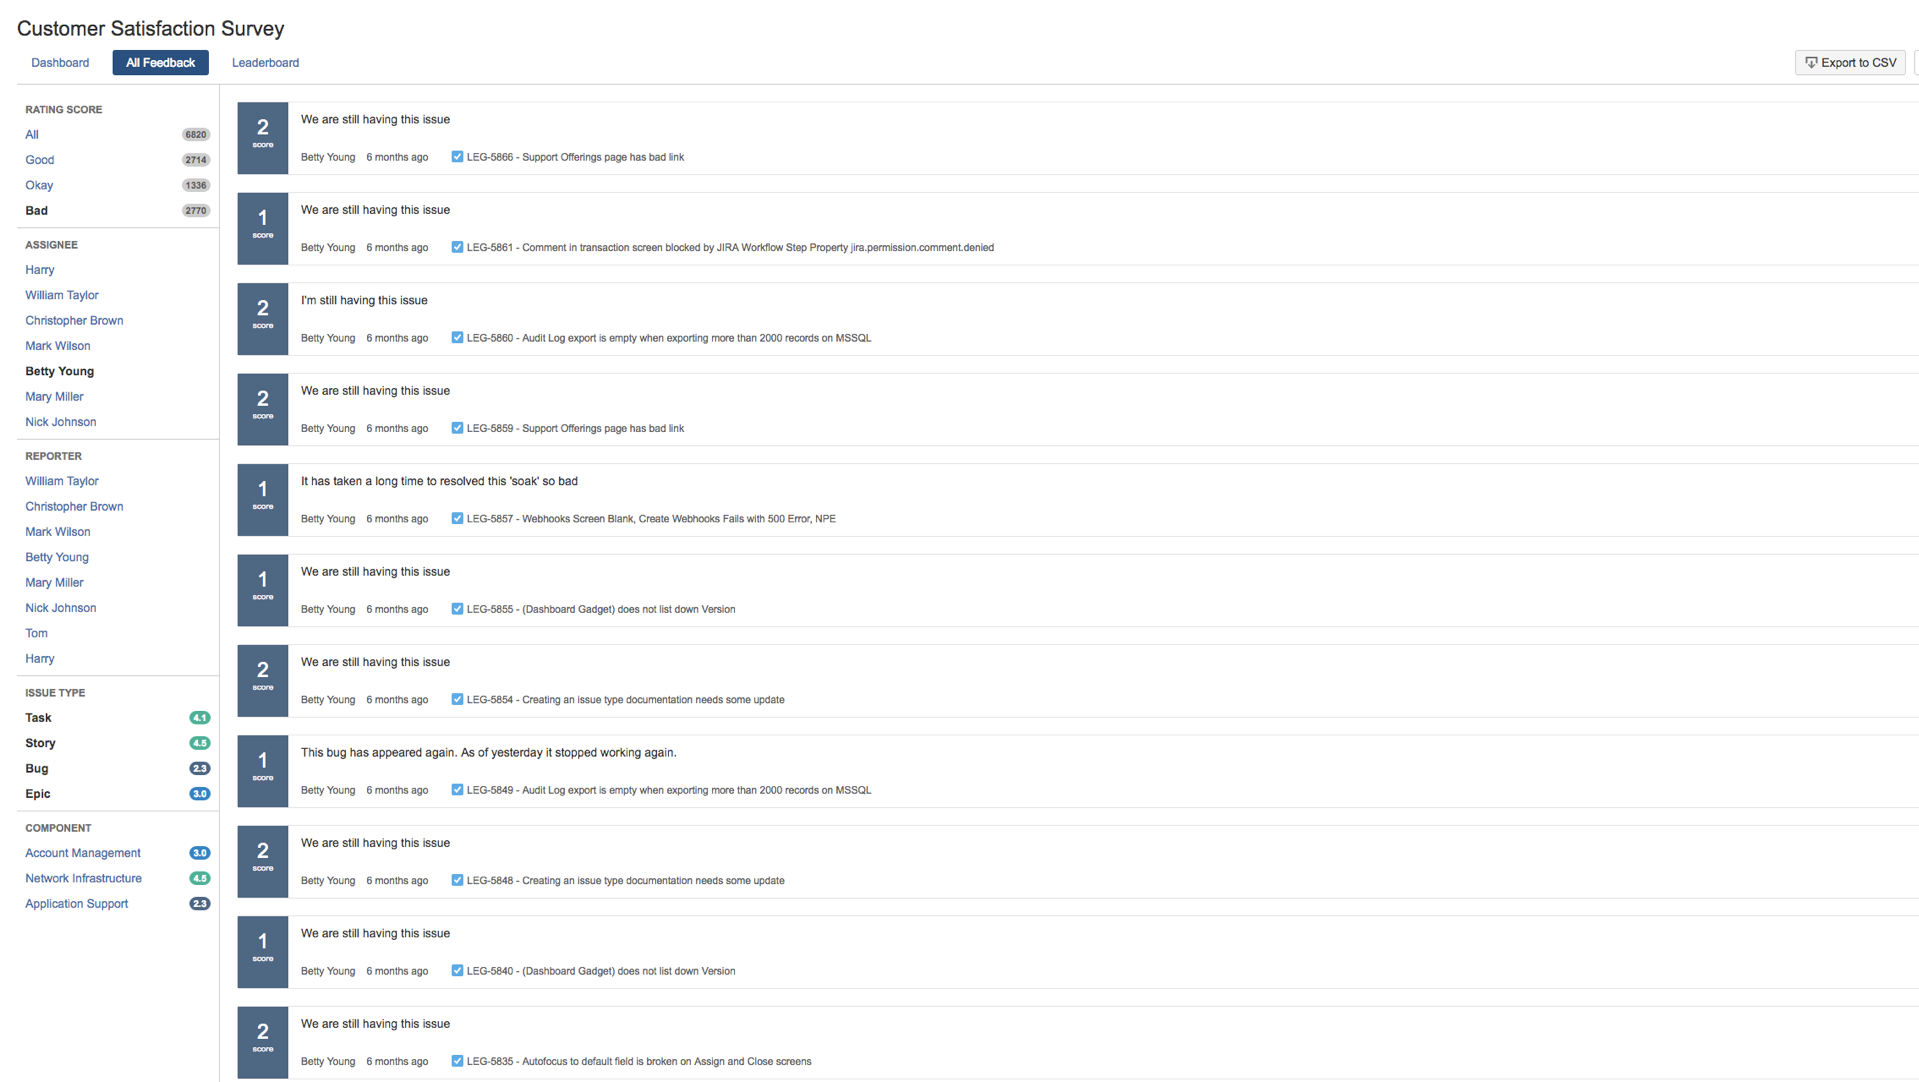
In this particular example, it reveals that Network Infrastructure & Stories are generally great, but Bugs and Application Support leaves something to be desired.
...
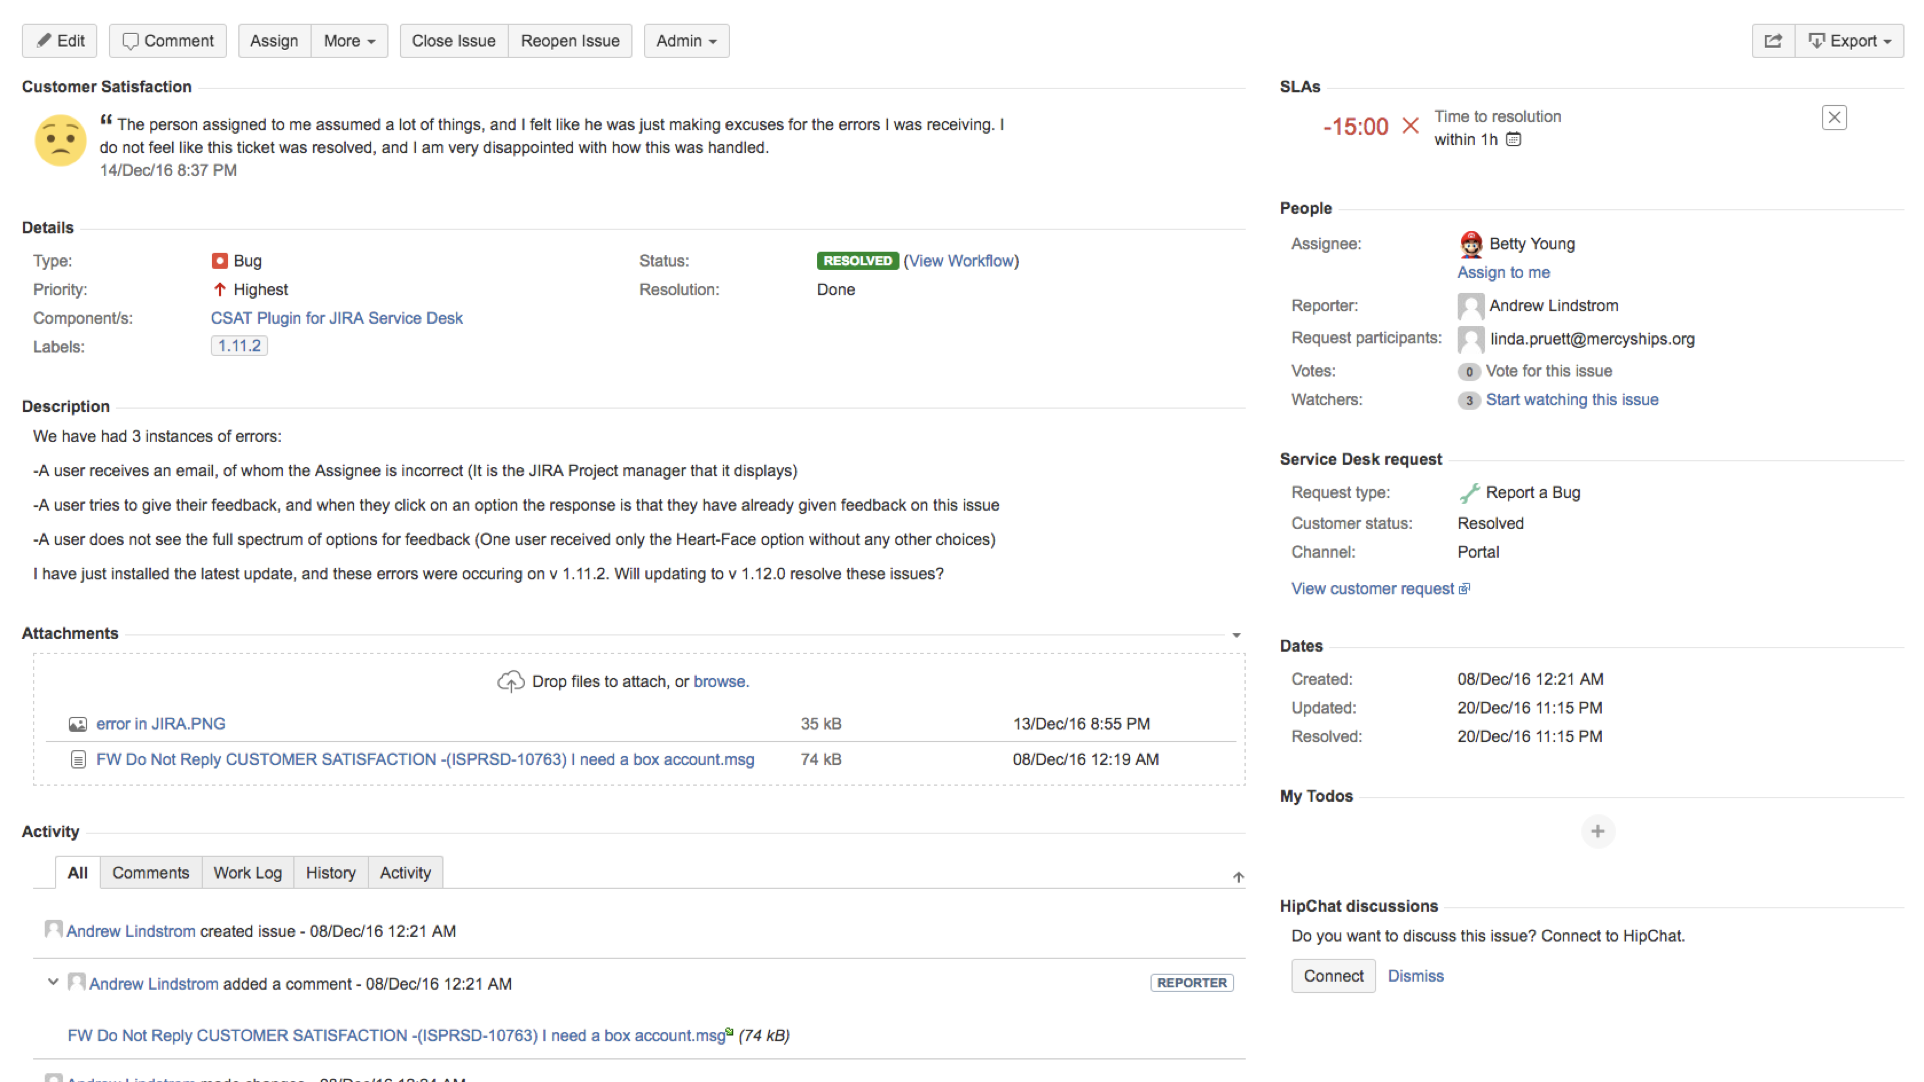
On the All Feedback Page, clicking on the ticket number will show you the details of the JIRA ticket

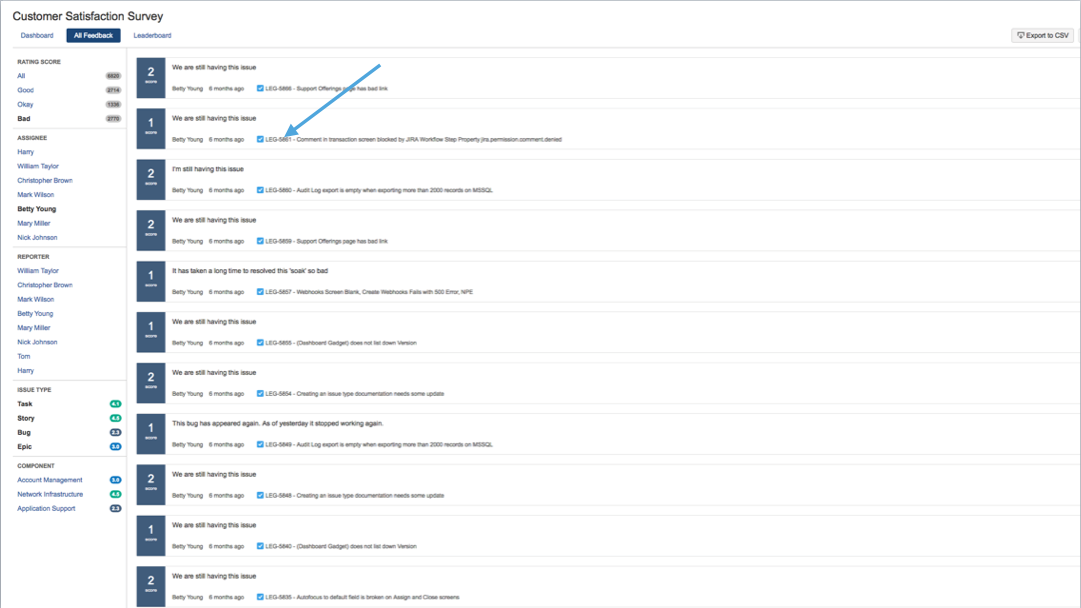
Here you can drill down on all the comments, work log, history or activities that happened on the ticket

Common themes:
...
- Happy agents = happy customers
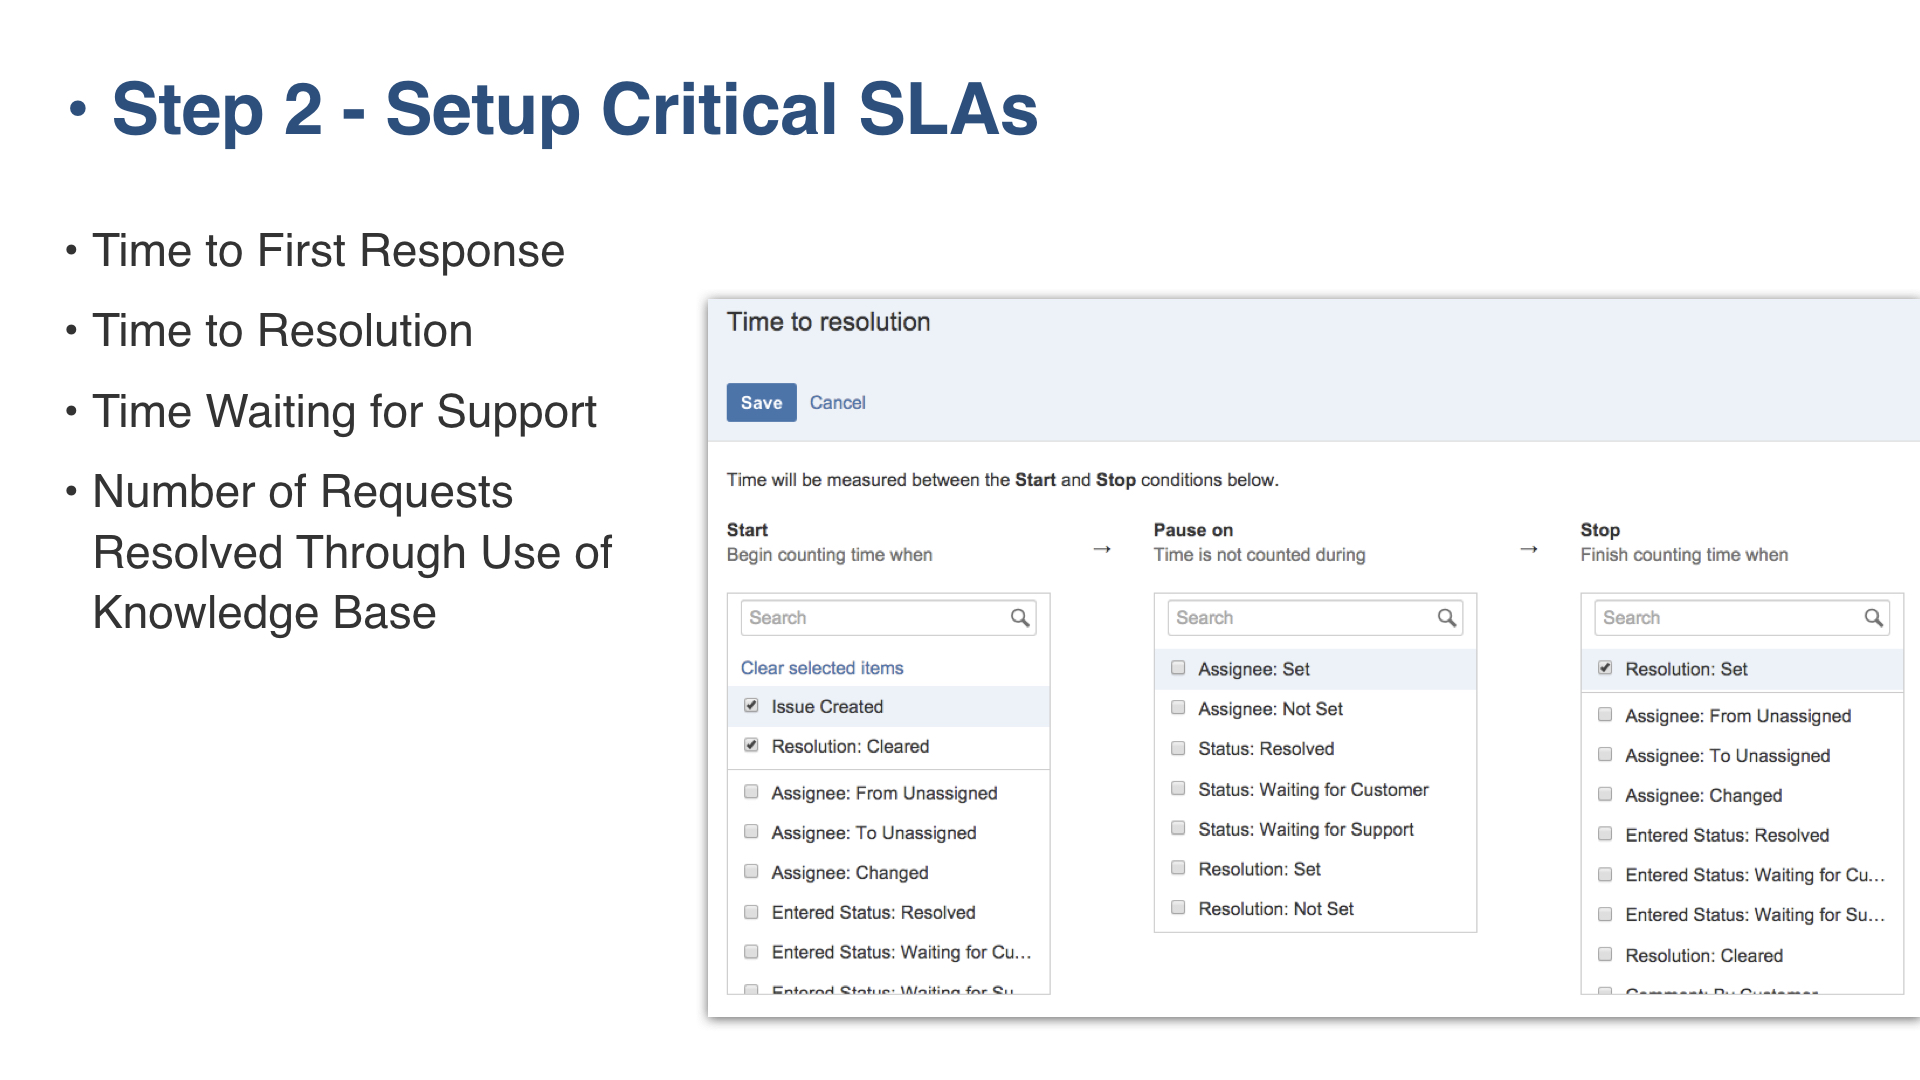
- Setup Critical Service Level Agreement (SLA)
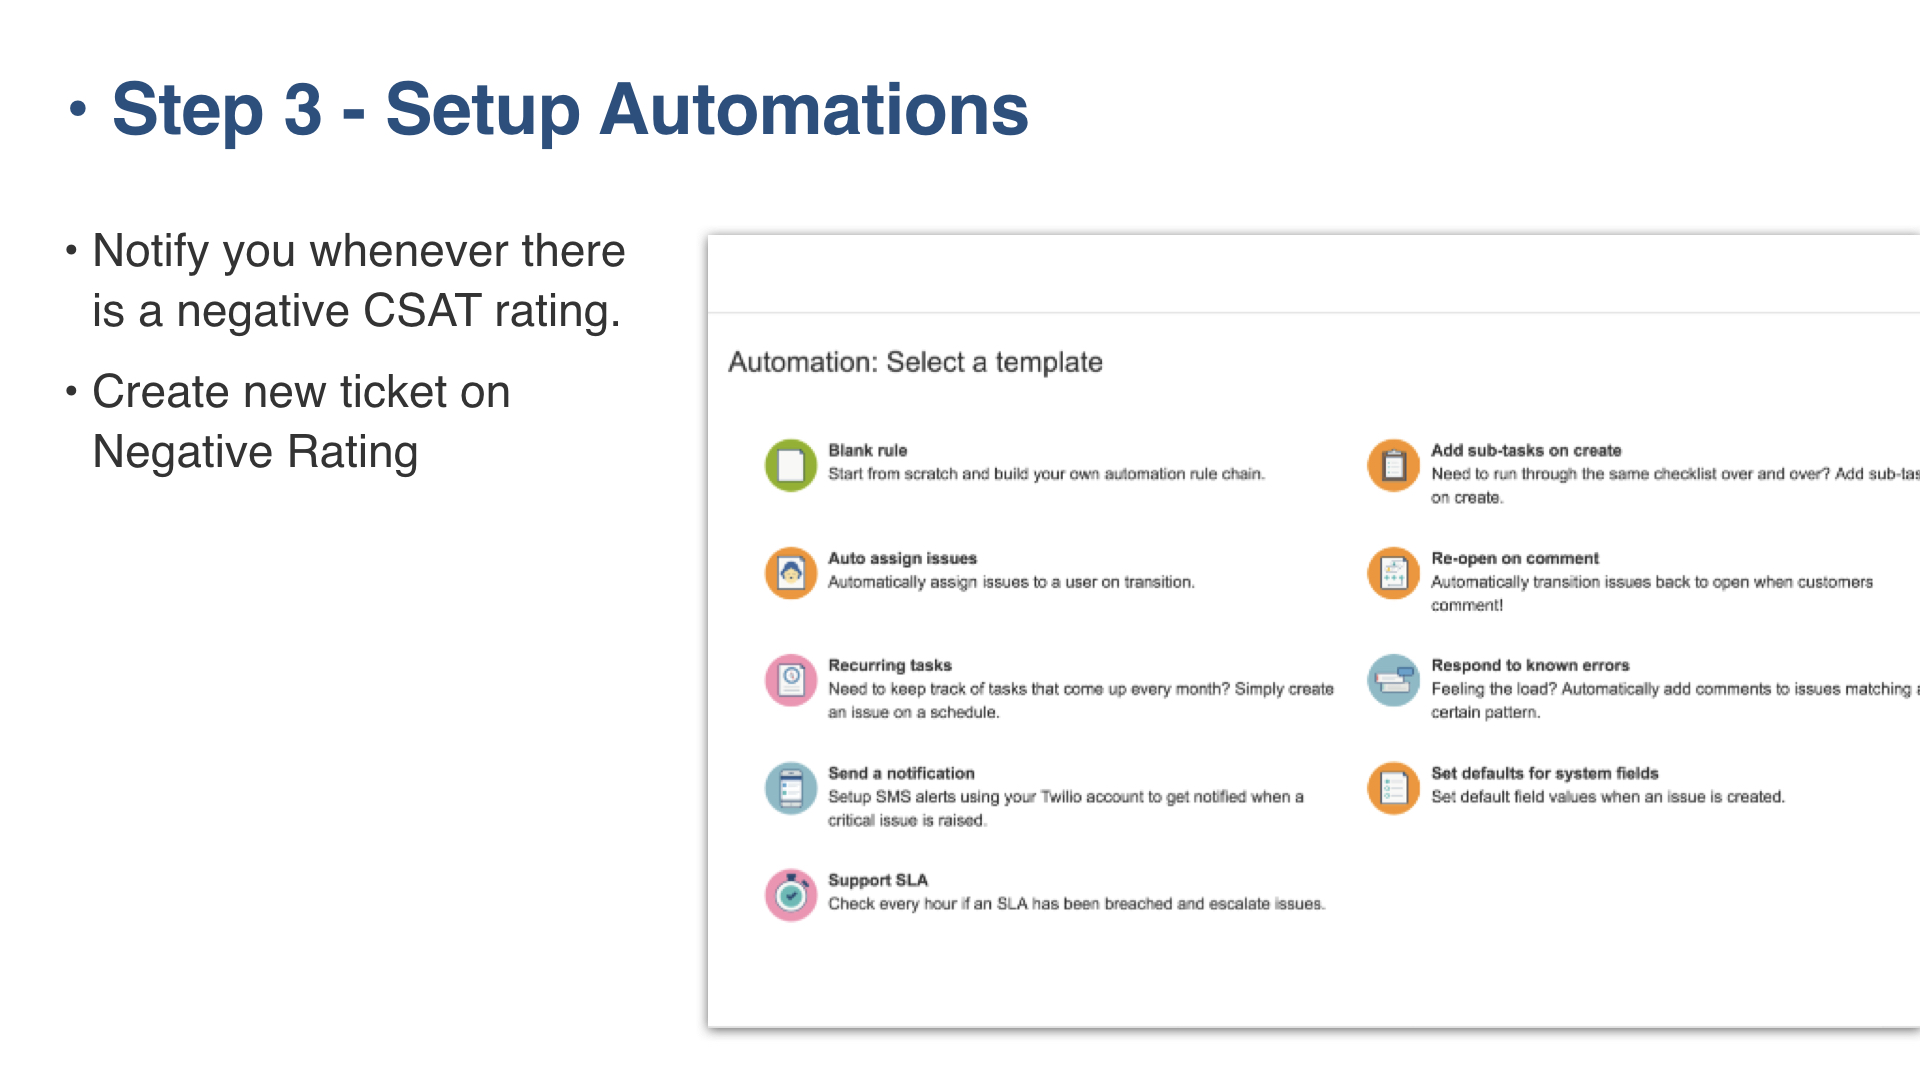
- Setting up Automation rules
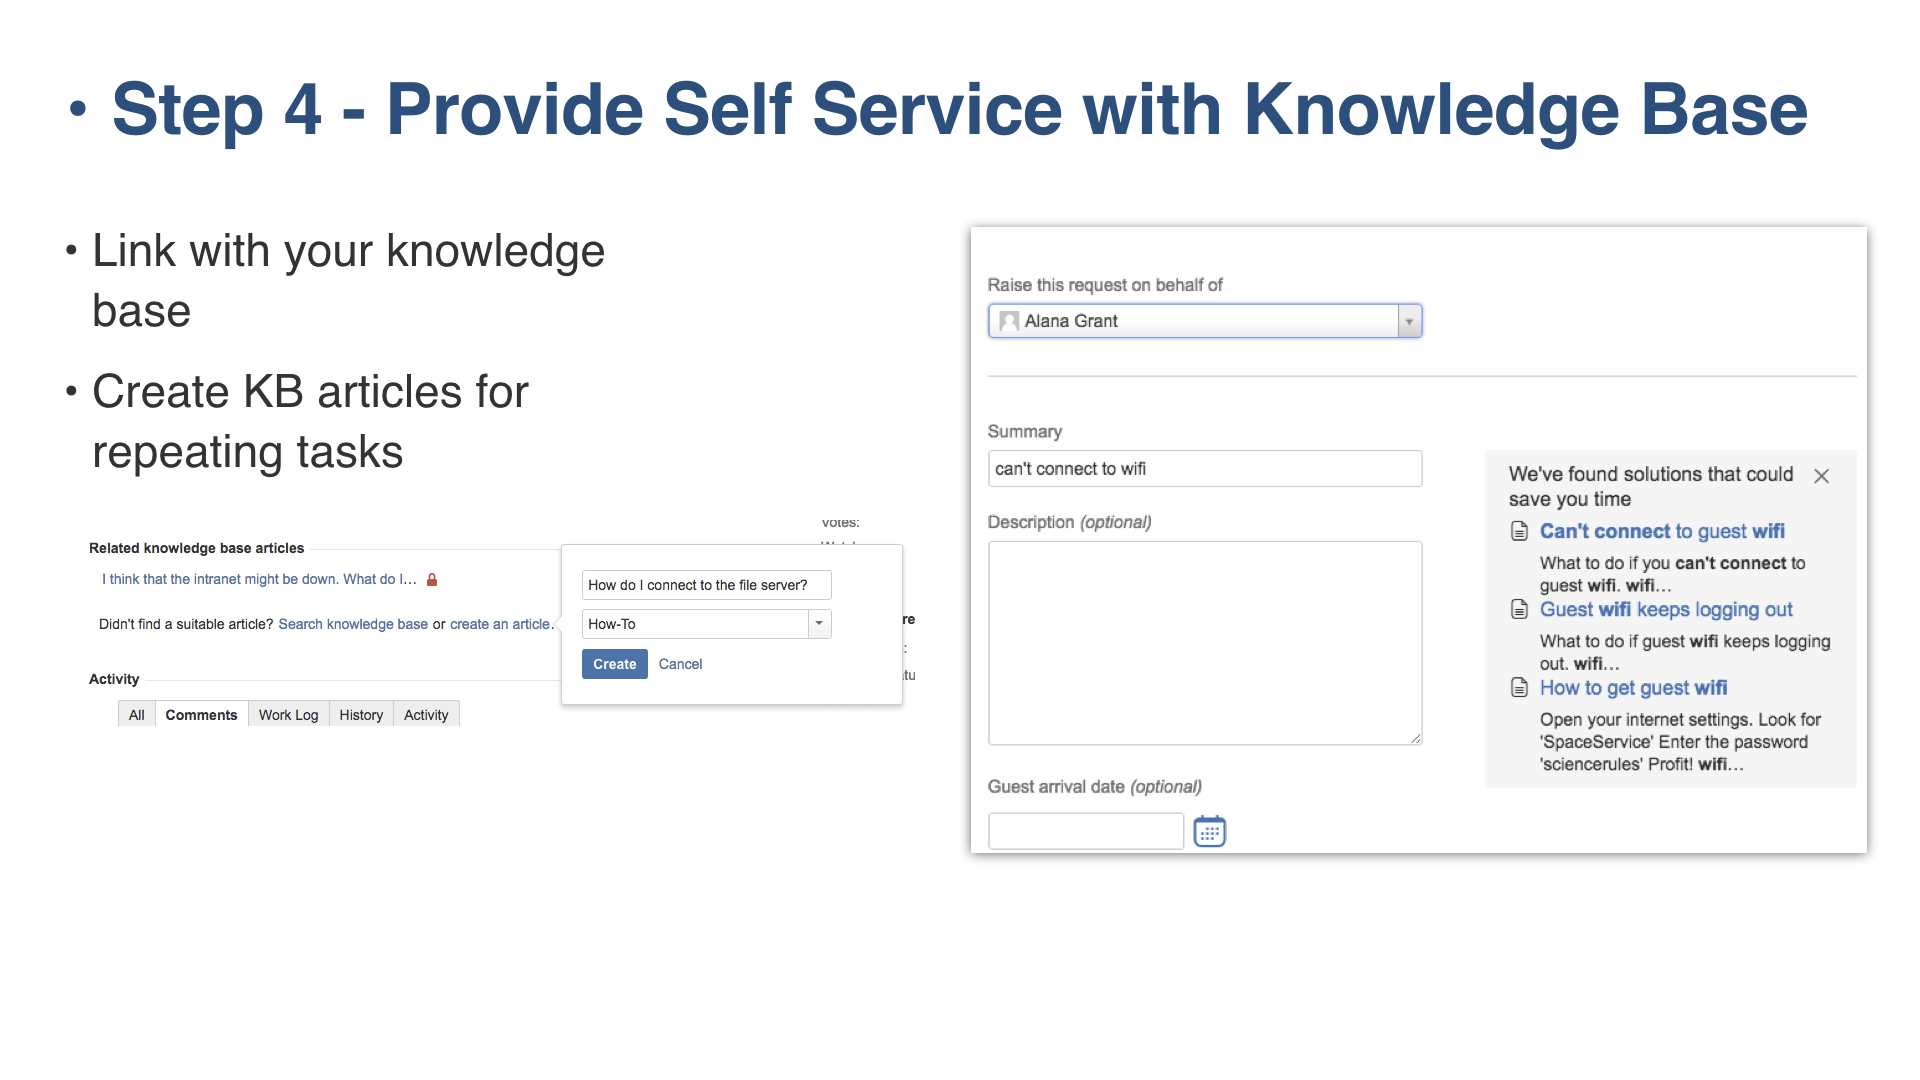
- Provide self help with Knowledge articles


...
Related articles
...